
Why can two Arkansas rivers look so different?
The Buffalo’s turquoise water explains one kind of difference. Measurements from three Beaver Lake tributaries reveal another that a photograph cannot show.
An Arkansas river’s color reflects what is in the water and how light meets it. NPS connects the Buffalo’s turquoise appearance to fine limestone particles. USGS measurements in the Beaver Lake watershed show why visible sediment and dissolved nutrients need separate comparisons. Clearer-looking does not mean less of everything.
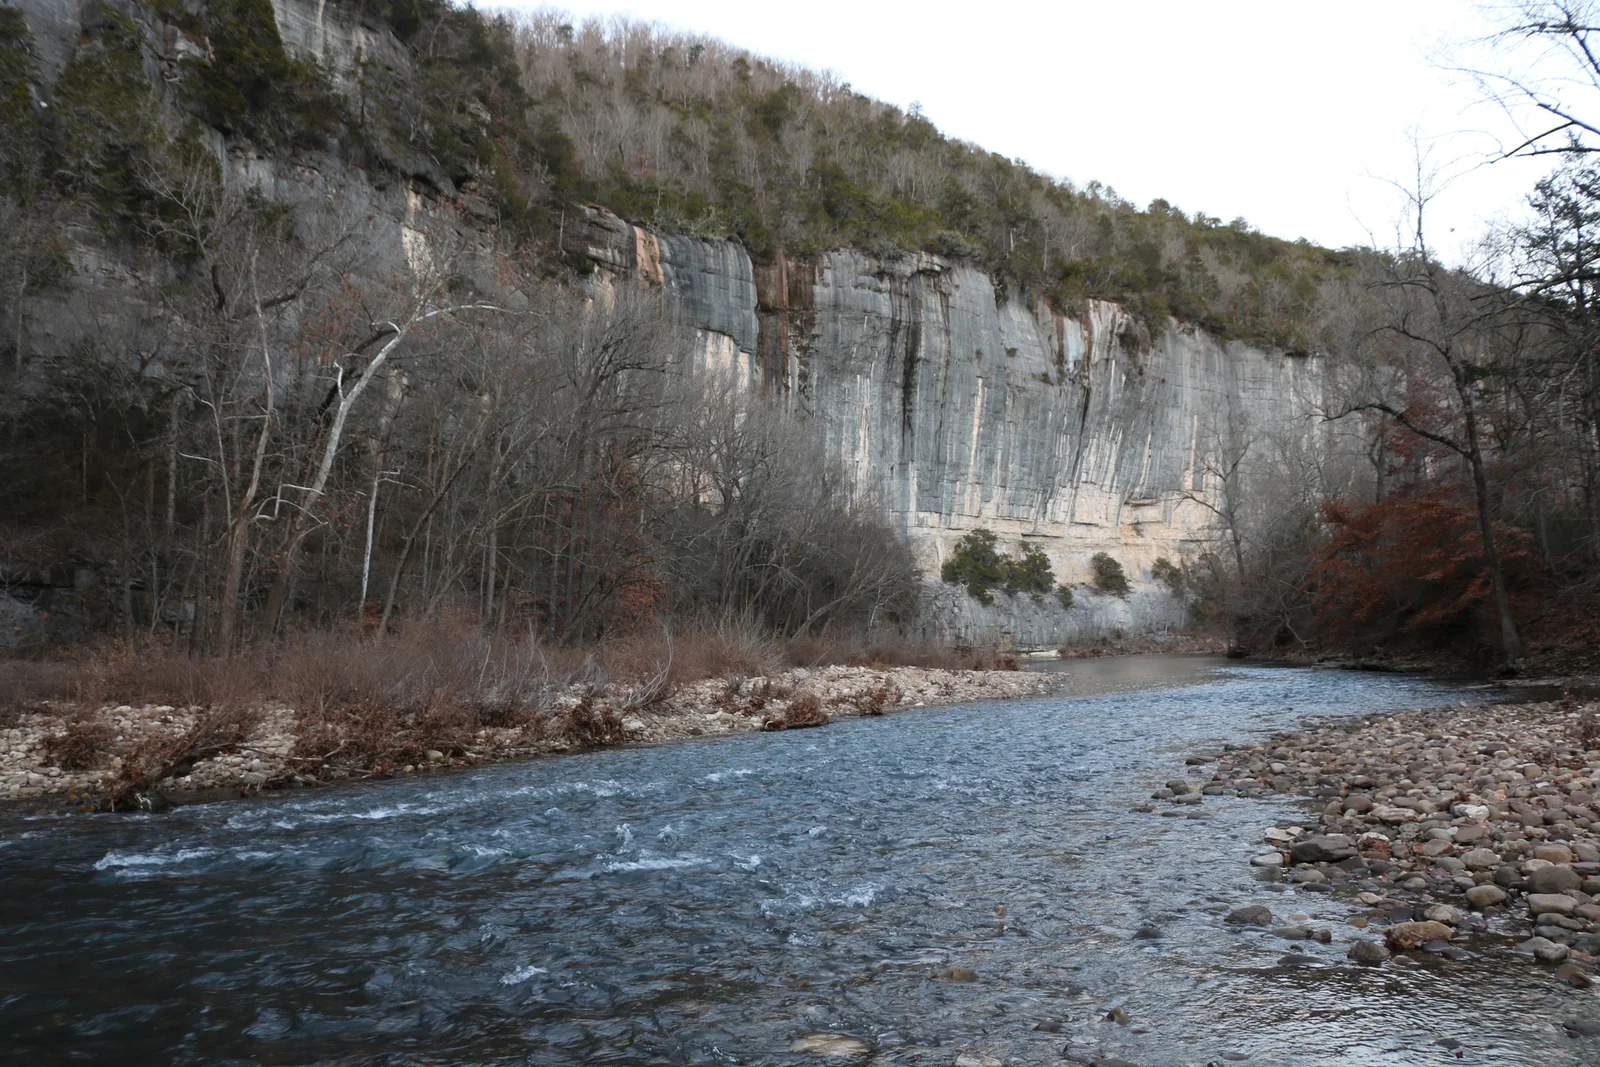
The Buffalo is not always turquoise
NPS describes an order of settling after rain: larger sediment first, finer limestone material later. Light meeting those fine particles can give the Buffalo its turquoise appearance. After a longer quiet spell, even that material can settle and the water can look clear. Two pictures taken days apart may record different stages of the same river.
That explains an appearance. It does not tell us everything a river carries. To see the difference, look west to the tributaries feeding Beaver Lake.
Sources: National Park Service / Buffalo National River: Turquoise Waters Explained
Less sediment. More nitrate and nitrite.
A 2010 USGS study compared named stations on the White River near Fayetteville, Richland Creek at Goshen and War Eagle Creek near Hindsville. Table 6 reports the historical values below. These are estimated mean flow-weighted concentrations, not samples taken today.
Richland had the lowest suspended-sediment concentration in this comparison and the highest dissolved nitrite-plus-nitrate concentration. That is the useful surprise. A lower sediment figure does not mean every other constituent is lower too.
| Arkansas station / study period | Suspended sediment (mg/L) | Dissolved nitrite + nitrate, as N (mg/L) |
|---|---|---|
| White River near Fayetteville / water years 1999–2008 | 136 | 0.57 |
| Richland Creek at Goshen / water years 2001–08 | 58.4 | 1.42 |
| War Eagle Creek near Hindsville / water years 2001–08 | 102 | 1.17 |
Sources: U.S. Geological Survey: Beaver Lake tributary study, 2010: Table 6, page 16
What the comparison can actually tell us
The Buffalo explanation and the Beaver watershed table answer different questions. One describes a visible optical effect. The other compares measured constituents at specific stations over stated periods. Putting them together gives us a better question than “which river looks cleaner?” Ask what was measured, where, when and under what flow conditions.
The table does not rank the Buffalo against these tributaries; the study did not make that comparison. Nor does it establish their present color, pollution source or swimming safety. “Clear” is a description of a view, not a laboratory result.
Next time you cross a river
Keep the location and date with the picture. Note recent rain and whether the water is rising or settling. USGS explains that suspended particles scatter light and affect turbidity, while dissolved material also can affect color. To go beyond the view, look for a measurement from that reach and read its parameter, date and status.
Around Arkansas’s comparison is a guide to choosing the right evidence. It joins the Buffalo explanation with a dated Northwest Arkansas study; it is not new sampling or an interview. The difference matters whenever a photograph seems to settle a bigger water-quality argument.
Sources: U.S. Geological Survey: Turbidity and Water · U.S. Geological Survey: Water Color
Have a question this story leaves open? Send it to the editorial desk. See something we should correct? Read our corrections policy. Material factual changes receive a dated note here.